

I recently had the opportunity to attend a webinar on agile product strategy given by our Director of Innovation, Chris Shinkle. Here are three tools I took away from the presentation that you can use to develop an agile product strategy that works.
The Problem
Do any of these situations sound familiar?
- Your product strategy isn’t clearly connected to business objectives
- Communication between your product teams and business team is poor
- Team morale is low
- Team throughput (and output) is low and unpredictable
Chances are, one (or all) of these problems hit a little too close to home.
Lots of our clients have tried to solve these problems by building a “better” product roadmap, but haven’t had success.
While a roadmap is a great strategic communication tool, it doesn’t allow you to test the logic of your plans or provide your teams with focus and clarity.
So what should you do?
You have to start by understanding what strategy is actually about: placing bets and making hard choices.
The objective is not to eliminate risk but to increase the odds of success, as explained in the Harvard Business Review’s article, The Big Lie of Strategic Planning.
Three rules help us build out a strategy based on placing good bets and making hard choices.
- Keep the strategy statement simple. We need to limit work in progress (WIP) and provide focus for product teams.
- Recognize that strategy is not about perfection. We need to reinforce the idea that strategy involves making an imperfect bet.
- Make your logic explicit. We need to test the logic of our thinking so that we can improve the accuracy of our strategic choices.
We use three tools related to these guidelines to help us develop product strategies. We’ve found these tools to be helpful to our clients, and they’ve been valuable tools in our experience as well.
Kanban Portfolio
A tool called the Kanban Portfolio aligns with the first guideline: keep the strategy statement simple and provide focus.
While traditional Kanban Systems serve as physical or digital project management tools to help visualize work, limit WIP, and maximize efficiency at the team level, Kanban Portfolios help measure and track progress on big-picture business objectives.
The system is made up of cards that look like this:
You can think of cards in a Kanban Portfolio as business objectives. Each card in the Kanban system includes an Objective and several Key Results (together abbreviated OKRs). An objective is a single sentence that’s qualitative and inspirational. A key result is a quantitative measure of progress toward achieving the Objective.
The Kanban system uses columns on the board to represent a specific activity or status of your cards. These columns can be as simple as “To Do,” “Doing,” and “Done,” or can be much more complex. At its simplest, a Kanban board looks like this:
Kanban helps provide focus and clarity for teams by limiting WIP. A WIP limit is the maximum number of cards that can be in a given column at one time. WIP limits expose bottlenecks in the workflow and show you when you’ve committed to too much work, or when using a Kanban Portfolio, too many business objectives.
You can add a Validation priority queue which measures outcomes against Key Results after deployment. The validation phase will result in either a “Win,” meaning you’re on the right track, “Loss,” meaning you were wrong, or “Pivot,” meaning you’ve realized something that you should pivot your strategy. Validation essentially says, “Let’s check to see if it met the objective we set out to accomplish.”
In essence, each Kanban card is a bet you’re making. We’ve found the following framework to be helpful in articulating your bet:
“We believe that if we deliver [solution name] for [target customers and users] we’ll observe [specific outcomes] that we could measure by [specific metrics].”
Business.io, formerly Kanbanize, has further resources on Kanban Portfolio that you can access here.
Takeaway: Use a Kanban Portfolio to manage the number of objectives the business is working toward by creating visibility and managing flow + WIP.
Opportunity Solution Tree
An Opportunity Solution Tree is a way of visually representing how you plan to reach a desired outcome, as Teresa Torres of Product Talk explains. It gives business context to the features you’re building and makes your bets explicit.
An Opportunity Solution Tree includes an objective, opportunities, features, and experiments. It looks like this:
An objective is your desired outcome. Opportunities include customer problems, needs, or wants. Features are solutions that deliver on these opportunities. Experiments are things we need to go learn or test.
A list of features with no context makes prioritization difficult. To discover this context, we can do what we call “walking the tree.” We work our way up the opportunity solution tree, from a feature all the way up to the objective. This helps us answer questions like:
- If we deliver Feature F, what problem does that solve for our customer?
- How else might we solve this problem?
- If we solve this specific problem, what happens to our overall objective?
Walking the tree can reveal simpler or different options for solving a pain or want rather than being stuck on a particular feature. It shows us that we prioritize objectives and opportunities by prioritizing the features feeding into them.
Walking the tree also makes our assumptions explicit. It helps us to clearly see the “bets” we’re making. For example, we believe that by building Feature F, we will make progress on Opportunity O, which will allow us to reach Objective A.
Takeaway: Use Opportunity Solution Trees to make assumptions explicit and ensure everything we build is tied to a business need or opportunity.
Feature Story Maps
A feature label, like “sign in,” doesn’t create shared understanding. For example, if we ask 5 people what they think a “sign in” feature includes, we’ll probably get slightly different answers from every one of them. Instead, we break features down from user activities into the tasks and details that make up those activities. These activities, tasks, and details make up a Feature Story Map that follows the user’s journey. It looks like this:
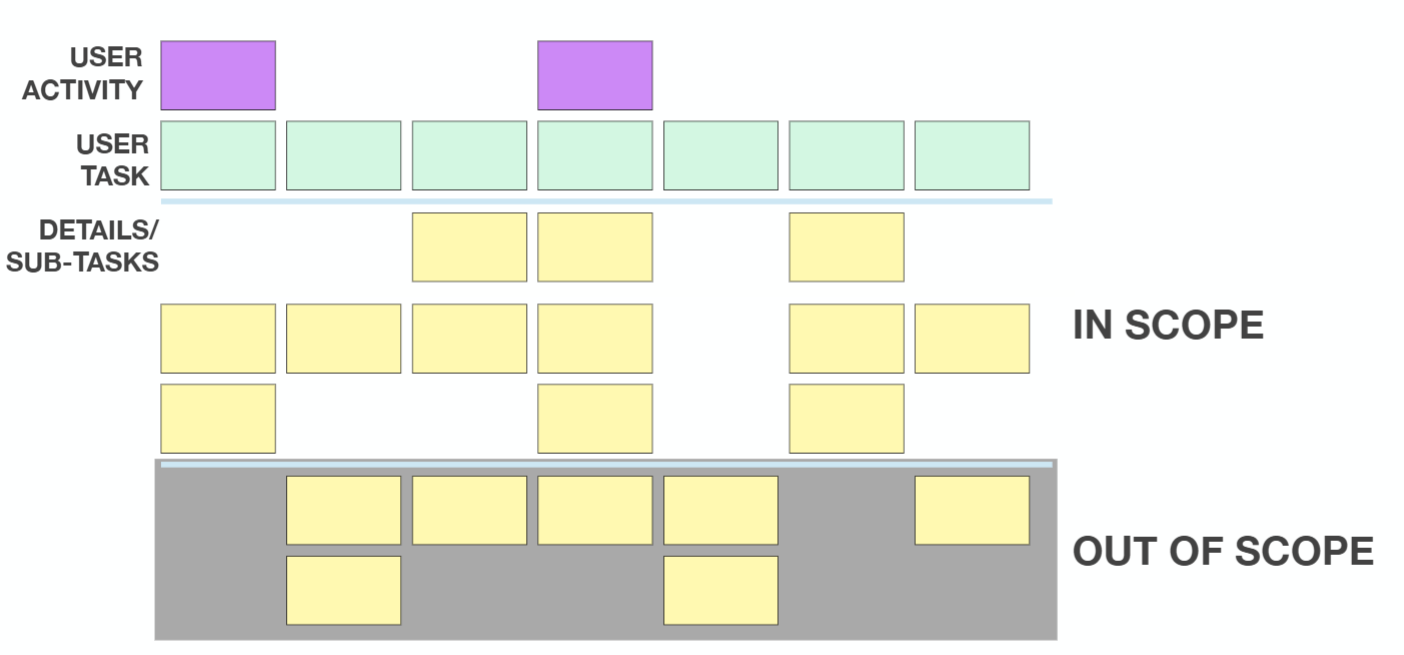
We can also add in In Scope and Out of Scope lines (indicated by the light blue lines in the image above). These help us prioritize work and balance our “bets,” the time and money we spend on a deliverable, against our confidence. Risks/Spikes represent things we need to learn before we invest time and money in building a feature.
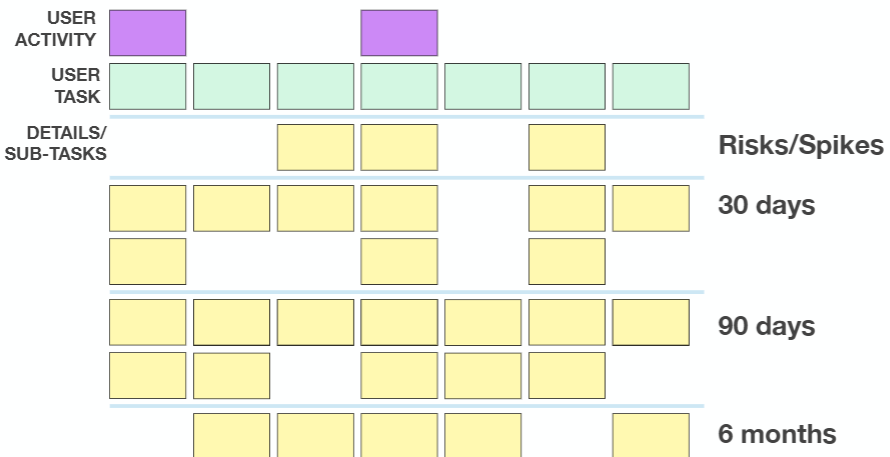
There are a few different ways to slice your map into In Scope and Out of Scope sections. One option is to slice by deliverable. We ask, “What level of confidence do we have in terms of moving the needle toward the business objective with this delivery?” Could we deliver the 30-day version of our product and solve our customer’s problems, or do we need to deliver the 90-day or 6-month version in order to achieve that?
We can balance slicing between features – for example, maybe we decide to deliver the 30-day version of Feature A, but we decide to deliver the 90-day version of Feature B.
When delivery teams slice the work this way, we give the business “levers” to pull to figure out what needs to be built to reach the business objectives.
Story maps help make bets explicit, give the business options for bettering their odds, and help teams avoid haggling over story estimation or size. In the end, they allow us to arrive at a workable solution.
You can find further resources on Feature Story Maps from our friend, Jeff Patton, here.
Takeaway: Use Story Maps to avoid haggling over story estimation and clarify expectations around delivery.
How to implement these tools in your organization
Now that you have all these tools, you may be thinking, “That’s great, but now what? My organization is too large, resistant, fill in the blank for me to actually put these into practice.” We get it – here are some tips to implement these tools in your own organization, one step at a time.
Start by using these tools on a small scale, within your team, and they’re likely to spread. Visuals communicate more than a document and are quicker to produce than a document. This makes them easy to adopt as others within your organization observe you using them.
Use these tools to complement what you’re already doing, rather than trying to revolutionize your organization’s process all at once. Build a story map or opportunity solution tree in addition to the traditional process and documentation. Using these new methods can also reveal holes in the traditional method.