

The Goal
Someone recently told me in passing that they wished they had a machine learning sandbox. I didn’t know what that was exactly, but I had a few ideas about what it might be. I wrote down some notes about what I thought a machine learning sandbox might do for someone, and how it might be implemented. Then, I set out to see where I and the world disagreed.
Selecting Evaluation Criteria
Critical Features
I knew that I was looking for something that could take in large amounts of data, train some models, and evaluate those models. That was the key feature of any machine learning sandbox. To be clear, it needed to provide libraries to train classifiers and function estimates and whatever else sort of machine learning someone might want. The target audience weren’t folks that were going to be implementing their own machine learning from scratch — at least, not at first. Beyond that basic requirements, I consider a few features make or break: the ability to easily score models, being able to package and ship a trained model somewhere else, and some way of visualizing the data being used for training the models.
Nice-to-Have Features
There were a few things in the nice to have category as well: caching loaded and groomed data, the ability to automatically tune algorithm hyper-parameters, and to run empirical comparisons between sets of trained models to get an overall evaluation. These could all be done by hand, but something that makes the process automated is going to save a lot of manual effort that’s better spent on more productive things.
Selecting Competitors
Given the features I was looking for, a couple of obvious choices jumped out. Both Microsoft and Amazon’s cloud based ML offerings meet the feature requirements I had set out. I needed to find something that could work for folks that couldn’t or were reluctant to go to the cloud right off the bat as well. I figured those folks could use a wide array of open source libraries for machine learning and visualization, they just might need a little scaffolding code thrown in on top of the libraries. In addition, they might not share my taste in interfaces, so I thought I would look at doing things in Jupyter rather than emacs. Jupyter was also a natural choice because both AWS and Azure support running jupyter notebooks directly on their cloud resources.
The Task for Comparison
I needed some simple ML benchmark to run across all environments so that I could compare them to one another fairly. I decided to do train a number of digit-recognizers from the standard open datasets and compare the performance of multiple models on each of the platforms. I picked that task because it’s pretty straight forward to do, I’d already done the work by hand on my local machine recently, and because it would serve as a useful canary: if this was difficult to do on any of the platforms, then that platform wasn’t really a competitive offering for what I have in mind.
Evaluation Criteria
I settled on a qualitative evaluation. I was trying to see how what people provided aligned with what I personally wanted. There are other important questions and metrics, such as time to task completion, that would be worth thinking about if you wanted to do a rigorous evaluation and make a recommendation as to what tool someone should adopt. For me, I just wanted to see if there were blind spots in initial ideation on “what is a machine learning sandbox”. I’ll talk about the following qualia:
- ease of use
- ease of understanding
- ease of visualizing data
- ease of training models
- ease of evaluating models
- power of data visualizations
- completeness of available models
- completeness of evaluations
Digit Recognition with Jupyter Notebooks
I think of Jupyter feeling the same role that a tool like Maple or Matlab does. It’s meant as an aide for thinking about a particular problem, solving that problem, and communicating the solution of the problem to other people. Less cryptically, Jupyter is a tool that lets you combine code, rich formatted text, and visualizations in a single place. Jupyter could theoretically support any sort of programming language where we say code, but python and R seem to be first among first class citizens. The example I use below borrows liberally / steals outright from this scikit-learn example. I just lightly adapted their python and plugged it into a notebook for the purpose of this demonstration.
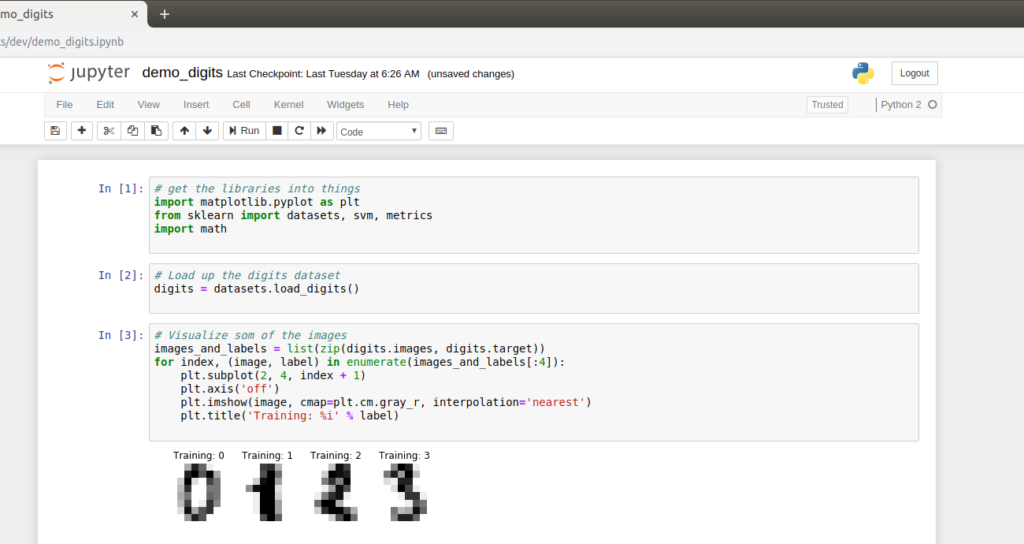
The above image shows the first few steps in a notebook that I created. While I’m far from a power user of the tool, I have been thinking of notebooks as equivalent to lab journals. Basically, a notebook in jupyter is the digital equivalent of the composition notebooks that I use for recording the things I do while trying to solve a technical problem. It has the advantage of being digital, and thus easy to save, distribute, and index. It has the drawbacks of not actually being paper, which makes it kind of hard to draw on.
The little grey boxes above are called cells, and I think of them as logical collections of action. For example, above in the first cell I import all of the supporting python libraries I’ll be using for the example. In cell two, I define the dataset I’ll be working with, and in cell 3 I visualize a bit of the data so that I can see what it looks like. There’s no reason that I couldn’t have bundled these all together, but I felt like they were separate thoughts so I split them apart.
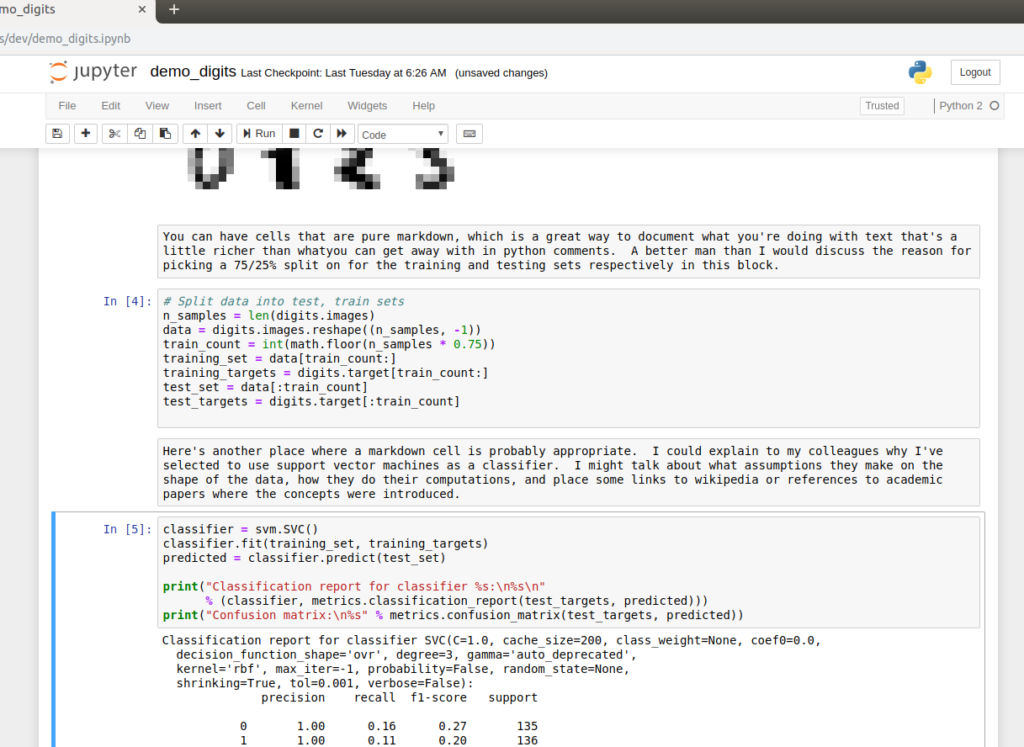
The first three cells were pure python code. I mentioned that Jupyter has the ability to mix prose, code, and media. We see that in the above image. The result of cell 3 is rendering an image of the digits we’re trying to classify from the dataset. The subsequent cell has some words saying that I should tell people why I selected a 75/25% split for my testing and training of the algorithm, and then cell 4 splits the data up into those groupings. Having the ability to put text describing what’s going on and why right along side the code that’s being executed is pretty powerful if the goal is to explain to someone else how the algorithms work, or to convince them that something reasonable is happening. It’s not what you want in a deployed system, I don’t think, but in the run up to deployment where you’re training your models and what not, it could be extremely helpful.
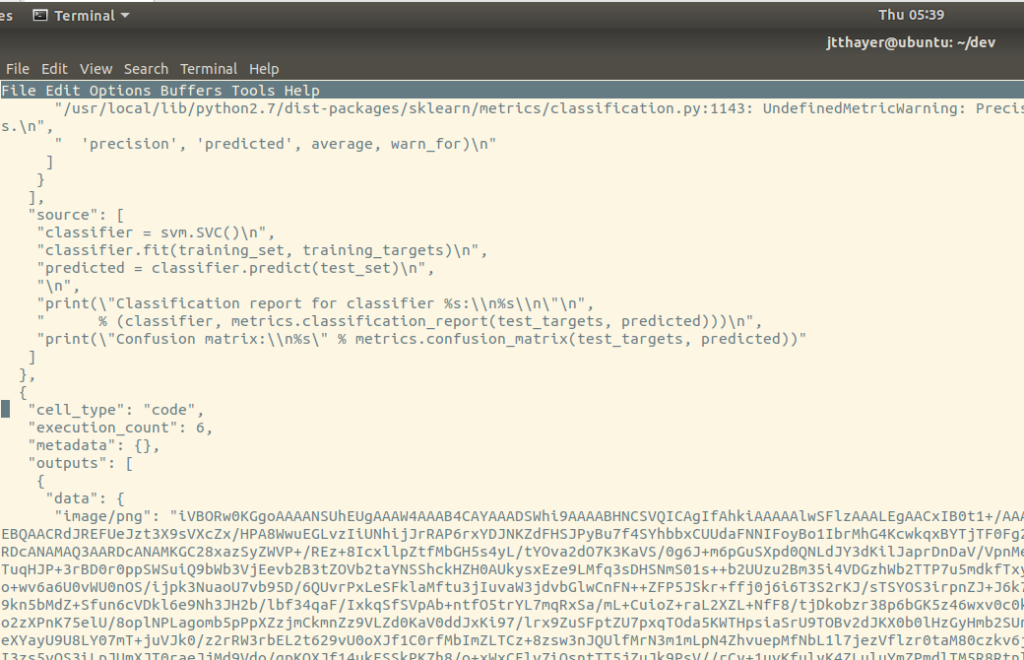
The above shows one way in which jupyter might store the notebooks you’re developing with it. Some of you will immediately recognize that we’re looking at a json file that pulls every element of the above living documents together. When I see this sort of thing, I get concerned about version control and other development tools. A monolithic file like this isn’t going to lend itself to version control or diff.
That’s a big concern for me, but I think maybe not as huge of a concern for the target audience. My typical work flow leans heavily into version control, linters, and tools like meld. I wouldn’t know what to do without them. That said, I program for a living, and the people whom a machine learning sandbox is targeted at likely don’t. That isn’t to say they don’t program or can’t program, just that they aren’t going to be using the same set of tools that I do, so they likely won’t notice the limitations that a file format like this introduces.
- ease of use – Easy to install, easy to get up and running, easy to tear down.
- ease of understanding – I think this is where Jupyter notebooks really excel. The way they intersperse code, prose, and visualizations makes it easy to convey a process and a conclusion to another person
- ease of visualizing data – It’s as easy as data visualization is in python, or R, or whatever kernel language you’re using. Which is to say, how easy you find data visualization in this tool is going to depend on how easy you find data visualization to be in python.
- ease of training models – As above, how do you feel about doing these things by hand by yourself, as there isn’t a bunch of baked in support.
- ease of evaluating models – As above
- power of data visualizations – Extreme. My personal opinion is that python has some of the best data visualization libraries available, when you consider completeness of the visualization techniques traded off against ease of use
- completeness of available models – Extreme. Python is one of the supported kernels for jupyter notebooks, and python has a good library for pretty much anything you could ask for, including machine learning.
- completeness of evaluations – Very complete, but you’re going to have to rely on knowing what to do yourself and rolling your own, or relying on one of the evaluations provided by a machine learning library.
Digit Recognition with Azure
Microsoft offers machine learning as part of their azure cloud offering. It’s possible to just run a jupyter notebook on top of Azure. Since we just looked at what jupyter provides, we won’t take a look at doing that again in this particular setting. In addition to being able to run Jupyter notebooks on someone else’s resources, Microsoft offers something called the Microsoft Azure Machine Learning Studio. It’s a largely graphical tool for building training machine learning models and building an evaluation.
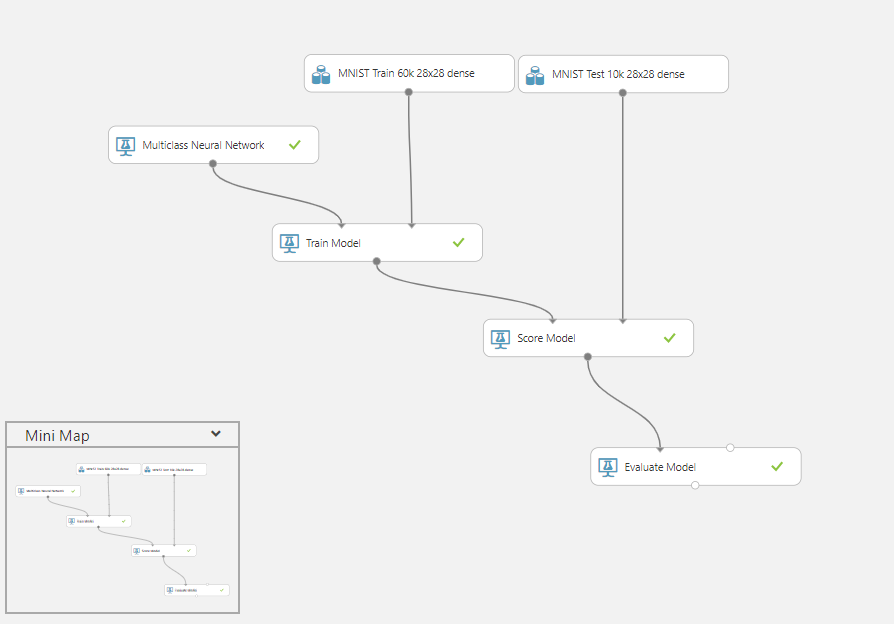
The above picture shows an evaluation of a single machine learning algorithm I built using the Azure ML Studio. The top two bubbles are me loading up the image recognition dataset. We setup a neural network for classification on the far left. The spine that ripples out from this leftmost node represents the training, scoring, and evaluation of the model. You can see that for these common steps in a machine learning evaluation, Azure ML has some drag and drop tools. There are some basic, and critical, tools that they provide not featured here, such as filtering and sampling of the data.
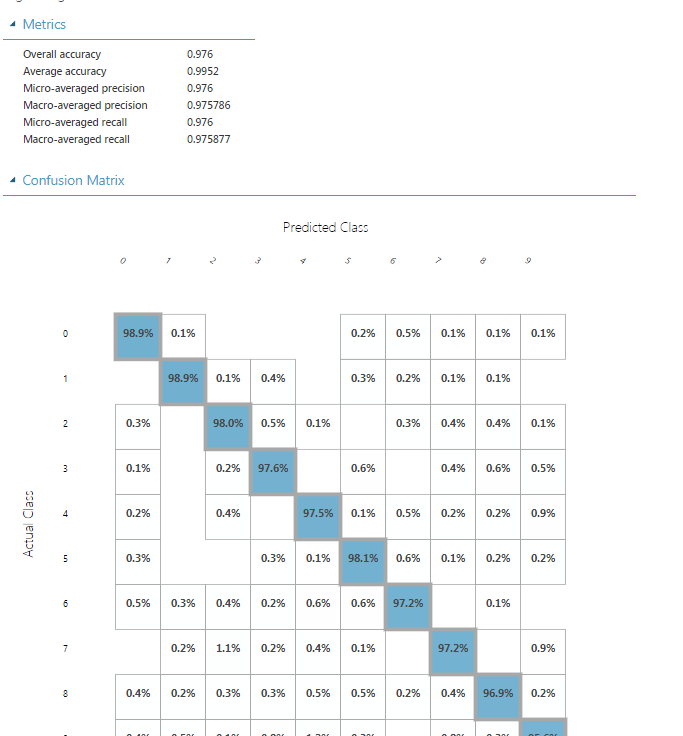
One place where the drag and drop functionality of Azure ML really shines, I find, is in the visualization of datasets. There are visualizations of nearly everything, if not everything, they provide in the GUI. Above we see a visualization of a confusion matrix generated while evaluating the ANN from the previous example. You don’t really need to paint a confusion matrix, but highlighting the cells with the highest scores, and seeing that they’re on the diagonal where you’d hope they would be, very quickly is nice.
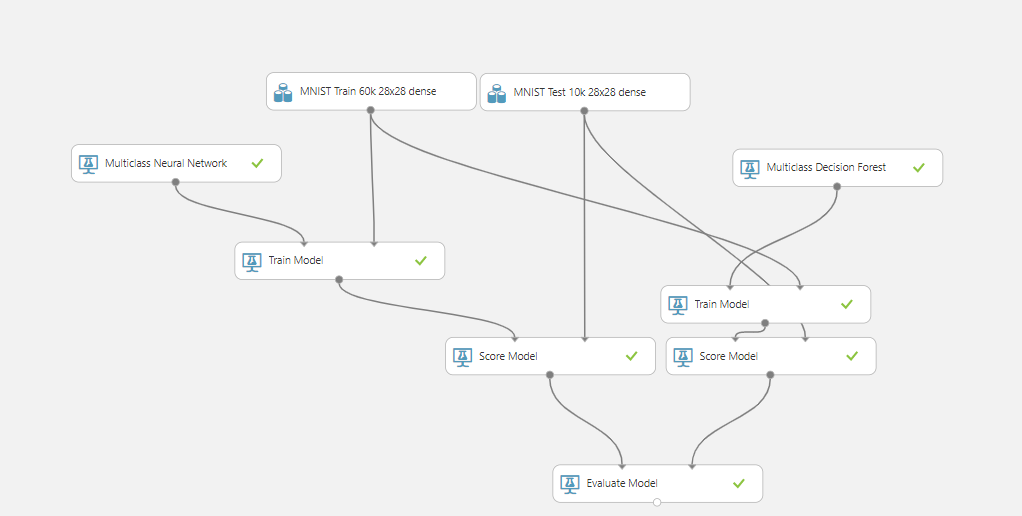
The experiment above compares the performance of two different machine learning algorithms that the suite provides. This was easy to do for two classes, but I think this is where some of the problems of a graphic programming interface start to become apparent. You can see that there are repeated segments in the evaluation, and there’s no easy way to wrap that functionality up or condense it as you would if you were factoring out common functionality in a program. Similarly, doing a side by side comparison is easy, but you could imagine how much the graph would explode if we were doing a full NxN comparison.
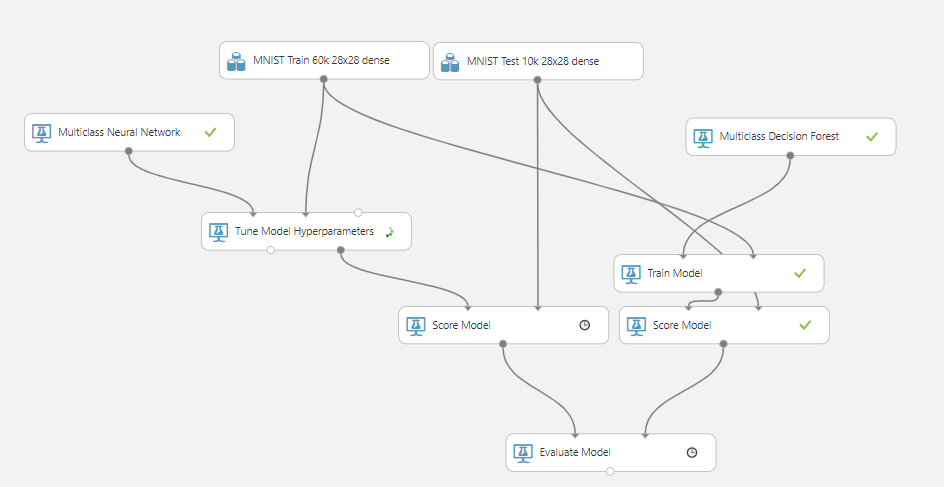
The above image shows doing some hyper parameter tuning on a machine learning algorithm in the ML studio. It’s really nice that they’ve provided some powerful convenience functions like these along side some very configurable machine learning algorithms. It’s also nice that they didn’t just bake in the hyperparameter tuning, because that stuff can be incredibly expensive depending on the size of the parameter space. For Azure, I’m just going to evaluate the ML Studio, but remember that you can take a jupyter notebook and just run it there should you so choose
- ease of use – Medium. The GUI is nice, but it also serves to obscure a lot of functionality that you need to touch. I initially struggled with simple things like filtering out columns of data until I learned my way around the tool.
- ease of understanding – Good. The visual flow of data does a lot to help you understand what’s going into training and evaluating your models
- ease of visualizing data – This is where the product really shines. If you want visualizations that aren’t made by default on each element, you may have to work harder, but the set of visualization tools that are baked in are great.
- ease of training models – Very easy
- ease of evaluating models – Very Easy
- power of data visualizations – Very Powerful
- completeness of available models – Medium. Certainly less things are available than you’d get from a single library like scikit-learn, but the classics are there. What’s available may change with time or if you have a paid account, I don’t know.
- completeness of evaluations – Fairly complete
AWS Sagemaker
Like Microsoft’s Azure, AWS allows you to run Jupyter notebooks directly on someone else’s resources. We’ve already looked at what Jupyter can do, so we won’t repeat it here. In addition, amazon lacks the sort of graphical user interface that Azure provides for its ML Studio. That said, the same sorts of things are present in both: jobs for labeling datasets, jobs for doing transformations on data, for training models, for hyperparameter tuning, and so on. That’s all great, but it comes with the downside of the system user needing to have a relatively deep understanding of the AWS cloud services.
The provided granularity of control is ideal for me, but probably off putting to the kinds of users I imagine. I don’t believe they want to consider how much compute power should be allotted to their training instances. Similarly, I think they don’t want to have to care about what data center their training and evaluation data live in, and so on. Where I might personally think that Azure’s ML Studio is too guided and might invite blindspots, I conversely think that AWS Sagemaker is too open, and invites decision paralysis, at least for the model of user I’m keeping in my head.
Summary and Conclusions
I wanted to take a look at various products that seemed like they competed in the space of the ill defined “Machine Learning Sandbox”. There are a couple of mature products, including AWS Sagemaker, Azure’s ML Studio, and Jupyter notebooks, that seem like they feel at home with that label. Each offering makes different trade offs between general expressiveness, ease of use, and usability. The right choice for you is likely going to hinge on the following:
- How comfortable you are with machine learning to start with
- How comfortable you are with your data being on someone else’s computer
- How familiar you are with programming generally
The further out you are on the “Understanding ML” and “Understanding Programming” spectrum of things you are, the more likely I am to recommend AWS and Sagemaker. I think Azure’s ML Studio is an interesting take on the idea of a machine learning sandbox, and if I were going to build one for someone there are certainly some features I would try to emulate.
That said, I think the biggest drawbacks to those two approaches are they fact that they’re cloud based. In my mind, the user has some data that they’re very protective of and is interested in exploring what can be done, as opposed to interested in delivering a highly available system that requires gobs of compute power to train and evaluate. To wit, for folks just starting out, the two cloud offerings spend a lot of effort solving problems that they don’t yet have. Barring a pre-existing commitment to one infrastructure or the other, I would start with local notebooks and only move to one cloud or the other when my patience and local compute resources were being stretched thin.
Unlock the Power of AI Engineering
From optimizing manufacturing materials to analyzing and predicting equipment maintenance schedules, see how we’re applying custom AI software solutions.