

Many projects involve creating a suite of system tests alongside application features. These tests can provide some benefits that may not initially be self-evident.
Generally, system tests are understood to provide several types of value:
- A mechanism for acceptance testing
- A regression suite for previously accepted application behavior
- Validating application behavior as part of your build pipeline
One non-obvious benefit the provide is to serve as the basis for finding performance issues in an application.
Real-world example
On a recent project, we started to notice that the application would slow down after long stretches of continuous use. I had no proof of it, but the issue simply “felt” like a memory leak.
While I believed I knew what the issue was, I didn’t know where the issue was. By that point the codebase was sufficiently large that looking for the issue by auditing the source was impractical.
On that project, we had a comprehensive set of system tests. That meant I had the tools available to navigate through the entire application in a repeatable automated fashion.
Since I didn’t know where the memory leak was, I created a test that simply navigated through the entire application in a loop. Running through that process with a memory profiler attached allowed me to see which objects were not being garbage collected. With that knowledge, I could backtrace to the source of the memory leak.
Re-use system tests components
The heart of creating utility tests is reusing elements of your existing system test suite. This works best when you have isolated the interactions with the application from the testing of the application. Tests written using the page object pattern are a great example of such isolation.
Those page objects can be used to interact with the application outside of the context of a verification test.
Example time
This concept is easiest to illustrate through an actual example. To that end, I’ve created an example that includes:
- A WPF application with memory leaks
- A suite of system tests for application behavior
- A “test” utility to exercise the application in a repeated pattern
The specific tools I’m using are TestComplete and dotMemory. The same techniques would apply with other testing and profiling tools. So you can use the tools you already have and are familiar with and still arrive at the same outcome.
Leaky code
Consider an example application with memory leaks. The constructor below attaches to two events from a provided object. However, nothing in the code ever detaches the event handlers.
public CategoryListItemViewModel(Category category)
{
  _category = category;
  category.PropertyChanged += CategoryOnPropertyChanged;
  category.Items.CollectionChanged += ItemsOnCollectionChanged;
}
This means that instances of CategoryListItemViewModel will not be garbage collected, even when they are otherwise dereferenced.
System tests
The example system tests used page objects for interaction with the application. That meant that an example verification test looked something like:
function ShowExistingCategory()
{
  window.ShowEditView();
  editPage.SelectCategory("Books");

  Assert.AreEqual("Books", editPage.Name().Text);
  Assert.AreEqual("Items: 3", editPage.ItemCount().Text);
}
Creating the memory-leak test
The system tests already had the application interaction abstracted into page objects. So a test for memory leaks would just involve using those objects to exercise all of the components in the application.
For this example, the following code exercises all of the application behavior:
function RunOneLoop()
{
  AddCategory();
  ShowList();
  RemoveCategory();
  ShowList();
}

function ShowList()
{
  window.ShowList();
}

function AddCategory()
{
  window.ShowEditView();
  editPage.AddCategory();
  editPage.Name().Text = "";
  editPage.Name().Keys("Testing");
  editPage.AddItem("Item 1");
  editPage.AddItem("Item 2");
  editPage.AddItem("Item 3");
}

function RemoveCategory()
{
  window.ShowEditView();
  editPage.SelectCategory("Testing");
  editPage.RemoveCategory();
}
Were all well with the application, it should be in the same state at the end of each loop.
This same set of interactions running in a loop will magnify any memory leaks in the application.
function RunLoops()
{
  for (var i = 0; i < loopsToRun; i++)
  {
    Indicator.PushText("Loop " + (1 + i) + " (of " + loopsToRun + ")");
    RunOneLoop();
    Indicator.PopText();
  }
}
All that is left is to start the application in the test and provide places to attach the memory profiler:
function Main()
{
  app.Start();
  WaitForProfilerStart();
  RunLoops();
  WaitForProfilerStop();
  app.Close();
}

function WaitForProfilerStart()
{
  BuiltIn.ShowMessage("Attach the memory profiler to process (PID " + app.Process().Id + ") and take the initial snapshot");
}

function WaitForProfilerStop()
{
  BuiltIn.ShowMessage("Use the profiler to take another snapshot");
}
Running the test
To look for the memory leak, run the Main function and start the memory profiler as indicated. Then go take a walk, get some coffee, or find something else to do for a while. When the test is done, take the final memory snapshot using the profiler.
Evaluating the results
For evaluating the results, I find that looking at the objects in memory is a good starting point. In this case, when I look at the objects in memory, I see that there are a lot of CategoryListItemViewModel objects still in memory:
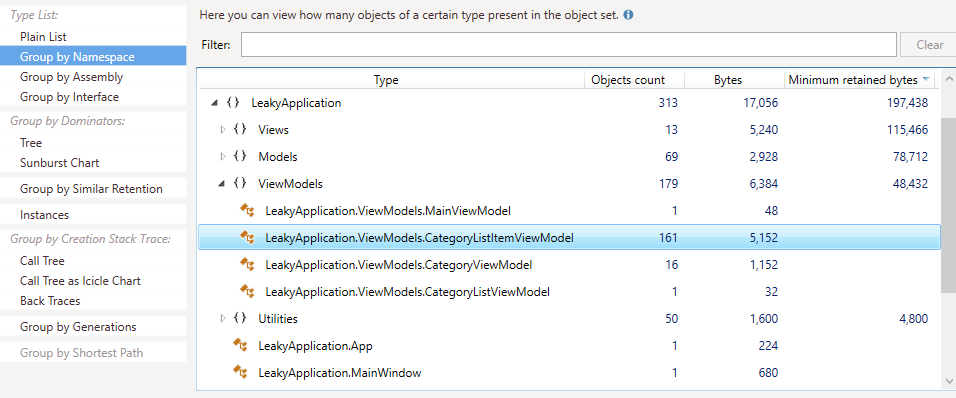
If I didn’t already know what the source of the memory leaks was, I’d now have a good starting point to look. Something is holding on to a reference to CategoryListItemViewModel objects and preventing them from being garbage collected.
All that would remain is to find the source of the problem and correct it. Then, running the same memory leak test would confirm that the issue was actually resolved.